3.4 KiB
Guide to Feature Graph Visualization
Catalogue
1. Overview
The feature graph is the feature representation of the input image in the convolutional network, and the study of which can be beneficial to our understanding and design of the model. Therefore, we employ this tool to visualize the feature graph based on the dynamic graph.
2. Prepare Work
The first step is to select the model to be studied, here we choose ResNet50. Copy the model networking code resnet.py to directory and download the ResNet50 pre-training model or follow the command below.
wget https://paddle-imagenet-models-name.bj.bcebos.com/dygraph/ResNet50_pretrained.pdparams
For other pre-training models and codes of network structure, please download model library and pre-training models.
3. Model Modification
Having found the location of the needed feature graph, set self.fm to fetch it out. Here we adopt the feature graph after the stem layer in resnet50 as an example.
Specify the feature graph to be visualized in the forward function of ResNet50
    def forward(self, x):
        with paddle.static.amp.fp16_guard():
            if self.data_format == "NHWC":
                x = paddle.transpose(x, [0, 2, 3, 1])
                x.stop_gradient = True
            x = self.stem(x)
            fm = x
            x = self.max_pool(x)
            x = self.blocks(x)
            x = self.avg_pool(x)
            x = self.flatten(x)
            x = self.fc(x)
        return x, fm
Then modify the code fm_vis.py to import ResNet50,instantiating the net object:
from resnet import ResNet50
net = ResNet50()
Finally, execute the function
python tools/feature_maps_visualization/fm_vis.py \
    -i the image you want to test \
    -c channel_num -p pretrained model \
    --show whether to show \
    --interpolation interpolation method\
    --save_path where to save \
    --use_gpu whether to use gpu
Parameters:
-i: the path of the image file to be predicted, such as./test.jpeg-c: the dimension of feature graph, such as5-p: path of the weight file, such as./ResNet50_pretrained--interpolation: image interpolation method, default value 1--save_path: save path, such as./tools/--use_gpu: whether to enable GPU inference, default value: True
4. Results
- Import the Image:

- Run the following script of feature graph visualization
python tools/feature_maps_visualization/fm_vis.py \
    -i ./docs/images/feature_maps/feature_visualization_input.jpg \
    -c 5 \
    -p pretrained/ResNet50_pretrained/  \
    --show=True \
    --interpolation=1 \
    --save_path="./output.png" \
    --use_gpu=False
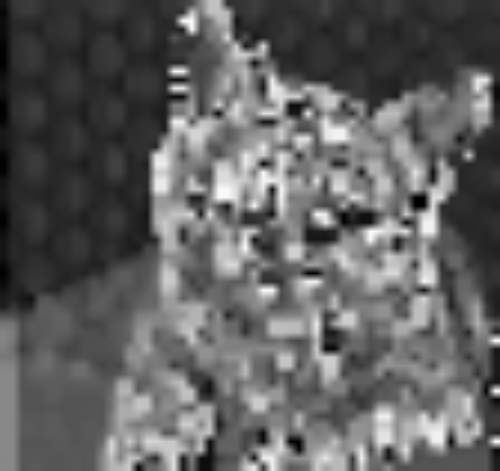
- Save the output feature graph as
output.png, as shown below.