3.1 KiB
3.1 KiB
特征图可视化指南
一、概述
特征图是输入图片在卷积网络中的特征表达,对特征图的研究可以有利于我们对于模型的理解与设计,所以基于动态图我们使用本工具来可视化特征图。
二、准备工作
首先需要选定研究的模型,本文设定ResNet50作为研究模型,将模型组网代码resnet.py拷贝到目录下,并下载ResNet50预训练模型,或使用以下命令下载。
wget https://paddle-imagenet-models-name.bj.bcebos.com/dygraph/ResNet50_pretrained.pdparams
其他模型网络结构代码及预训练模型请自行下载:模型库,预训练模型。
三、修改模型
找到我们所需要的特征图位置,设置self.fm将其fetch出来,本文以resnet50中的stem层之后的特征图为例。
在ResNet50的forward函数中指定要可视化的特征图
    def forward(self, x):
        with paddle.static.amp.fp16_guard():
            if self.data_format == "NHWC":
                x = paddle.transpose(x, [0, 2, 3, 1])
                x.stop_gradient = True
            x = self.stem(x)
            fm = x
            x = self.max_pool(x)
            x = self.blocks(x)
            x = self.avg_pool(x)
            x = self.flatten(x)
            x = self.fc(x)
        return x, fm
然后修改代码fm_vis.py,引入 ResNet50,实例化 net 对象:
from resnet import ResNet50
net = ResNet50()
最后执行函数
python tools/feature_maps_visualization/fm_vis.py -i the image you want to test \
                                                -c channel_num -p pretrained model \
                                                --show whether to show \
                                                --interpolation interpolation method\
                                                --save_path where to save \
                                                --use_gpu whether to use gpu
参数说明:
-i:待预测的图片文件路径,如./test.jpeg-c:特征图维度,如5-p:权重文件路径,如./ResNet50_pretrained/--interpolation: 图像插值方式, 默认值 1--save_path:保存路径,如:./tools/--use_gpu:是否使用 GPU 预测,默认值:True
四、结果
- 输入图片:

- 运行下面的特征图可视化脚本
python tools/feature_maps_visualization/fm_vis.py \
    -i ./docs/images/feature_maps/feature_visualization_input.jpg \
    -c 5 \
    -p pretrained/ResNet50_pretrained/  \
    --show=True \
    --interpolation=1 \
    --save_path="./output.png" \
    --use_gpu=False
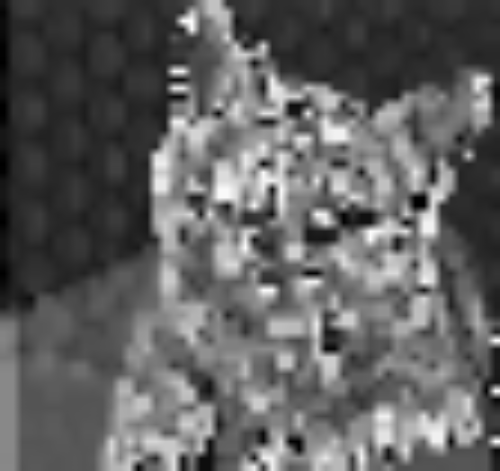
- 输出特征图保存为
output.png,如下所示。