2.1 KiB
Logging metrics and models
PaddleOCR comes with two metric logging tools integrated directly into the training API: VisualDL and Weights & Biases.
VisualDL
VisualDL is a visualization analysis tool of PaddlePaddle. The integration allows all training metrics to be logged to a VisualDL dashboard. To use it, add the following line to the Global section of the config yaml file -
Global:
    use_visualdl: True
To see the visualizations run the following command in your terminal
visualdl --logdir <save_model_dir>
Now open localhost:8040 in your browser of choice!
Weights & Biases
W&B is a MLOps tool that can be used for experiment tracking, dataset/model versioning, visualizing results and collaborating with colleagues. A W&B logger is integrated directly into PaddleOCR and to use it, first you need to install the wandb sdk and login to your wandb account.
pip install wandb
wandb login
If you do not have a wandb account, you can make one here.
To visualize and track your model training add the following flag to your config yaml file under the Global section -
Global:
    use_wandb: True
To add more arguments to the WandbLogger listed here add the header wandb to the yaml file and add the arguments under it -
wandb:
    project: my_project
    entity: my_team
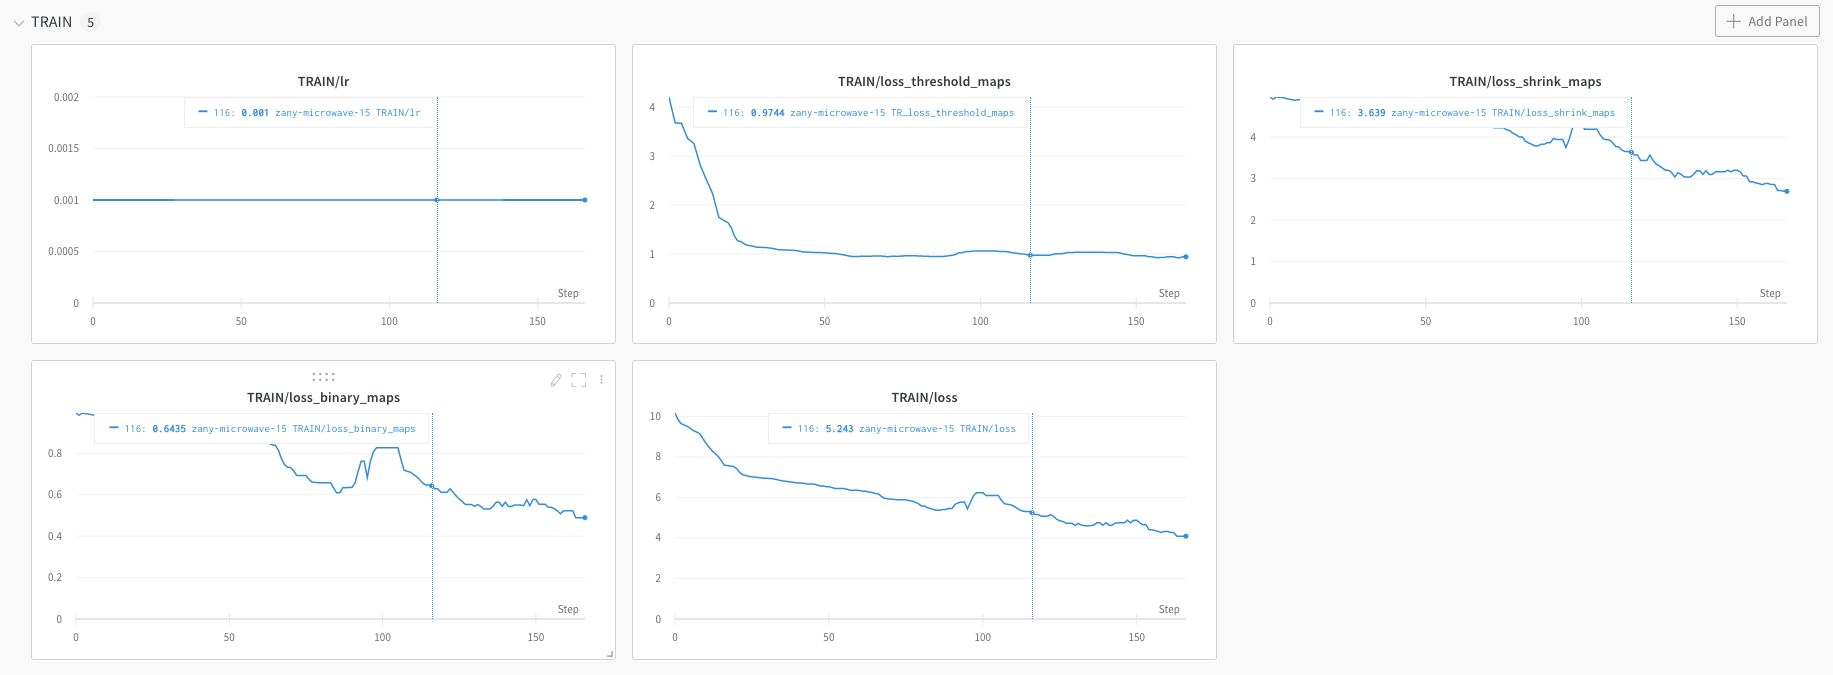
This will automatically log all the training and evaluation metrics to the W&B dashboard along with models at every model saving step and evaluation step are with the appropriate tags and metadata.

To view the dashboard, the link to the dashboard is printed to the console at the beginning and end of every training job and you can also access it by logging into your W&B account on your browser.
Using Multiple Loggers
Both VisualDL and W&B can also be used simultaneously by just setting both the aforementioned flags to True.