mirror of
https://github.com/open-mmlab/mmsegmentation.git
synced 2025-06-03 22:03:48 +08:00
Thanks for your contribution and we appreciate it a lot. The following instructions would make your pull request more healthy and more easily get feedback. If you do not understand some items, don't worry, just make the pull request and seek help from maintainers. ## Motivation Support inference and visualization of VPD ## Modification 1. add a new VPD model that does not generate black border in predictions 2. update `SegLocalVisualizer` to support depth visualization 3. update `MMSegInferencer` to support save predictions of depth estimation in method `postprocess` ## BC-breaking (Optional) Does the modification introduce changes that break the backward-compatibility of the downstream repos? If so, please describe how it breaks the compatibility and how the downstream projects should modify their code to keep compatibility with this PR. ## Use cases (Optional) Run inference with VPD using the this command ```sh python demo/image_demo_with_inferencer.py demo/classroom__rgb_00283.jpg vpd_depth --out-dir vis_results ``` The following image will be saved under `vis_results/vis` 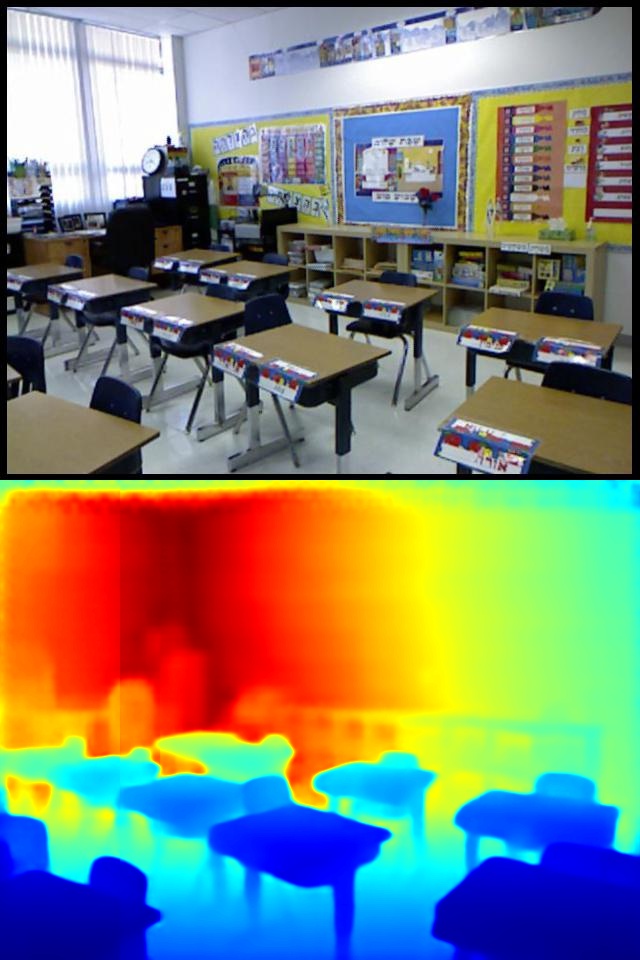 ## Checklist 1. Pre-commit or other linting tools are used to fix the potential lint issues. 4. The modification is covered by complete unit tests. If not, please add more unit test to ensure the correctness. 5. If the modification has potential influence on downstream projects, this PR should be tested with downstream projects, like MMDet or MMDet3D. 6. The documentation has been modified accordingly, like docstring or example tutorials.
350 lines
16 KiB
Python
350 lines
16 KiB
Python
# Copyright (c) OpenMMLab. All rights reserved.
|
|
from typing import Dict, List, Optional
|
|
|
|
import cv2
|
|
import mmcv
|
|
import numpy as np
|
|
import torch
|
|
from mmengine.dist import master_only
|
|
from mmengine.structures import PixelData
|
|
from mmengine.visualization import Visualizer
|
|
|
|
from mmseg.registry import VISUALIZERS
|
|
from mmseg.structures import SegDataSample
|
|
from mmseg.utils import get_classes, get_palette
|
|
|
|
|
|
@VISUALIZERS.register_module()
|
|
class SegLocalVisualizer(Visualizer):
|
|
"""Local Visualizer.
|
|
|
|
Args:
|
|
name (str): Name of the instance. Defaults to 'visualizer'.
|
|
image (np.ndarray, optional): the origin image to draw. The format
|
|
should be RGB. Defaults to None.
|
|
vis_backends (list, optional): Visual backend config list.
|
|
Defaults to None.
|
|
save_dir (str, optional): Save file dir for all storage backends.
|
|
If it is None, the backend storage will not save any data.
|
|
classes (list, optional): Input classes for result rendering, as the
|
|
prediction of segmentation model is a segment map with label
|
|
indices, `classes` is a list which includes items responding to the
|
|
label indices. If classes is not defined, visualizer will take
|
|
`cityscapes` classes by default. Defaults to None.
|
|
palette (list, optional): Input palette for result rendering, which is
|
|
a list of color palette responding to the classes. Defaults to None.
|
|
dataset_name (str, optional): `Dataset name or alias <https://github.com/open-mmlab/mmsegmentation/blob/main/mmseg/utils/class_names.py#L302-L317>`_
|
|
visulizer will use the meta information of the dataset i.e. classes
|
|
and palette, but the `classes` and `palette` have higher priority.
|
|
Defaults to None.
|
|
alpha (int, float): The transparency of segmentation mask.
|
|
Defaults to 0.8.
|
|
|
|
Examples:
|
|
>>> import numpy as np
|
|
>>> import torch
|
|
>>> from mmengine.structures import PixelData
|
|
>>> from mmseg.structures import SegDataSample
|
|
>>> from mmseg.visualization import SegLocalVisualizer
|
|
|
|
>>> seg_local_visualizer = SegLocalVisualizer()
|
|
>>> image = np.random.randint(0, 256,
|
|
... size=(10, 12, 3)).astype('uint8')
|
|
>>> gt_sem_seg_data = dict(data=torch.randint(0, 2, (1, 10, 12)))
|
|
>>> gt_sem_seg = PixelData(**gt_sem_seg_data)
|
|
>>> gt_seg_data_sample = SegDataSample()
|
|
>>> gt_seg_data_sample.gt_sem_seg = gt_sem_seg
|
|
>>> seg_local_visualizer.dataset_meta = dict(
|
|
>>> classes=('background', 'foreground'),
|
|
>>> palette=[[120, 120, 120], [6, 230, 230]])
|
|
>>> seg_local_visualizer.add_datasample('visualizer_example',
|
|
... image, gt_seg_data_sample)
|
|
>>> seg_local_visualizer.add_datasample(
|
|
... 'visualizer_example', image,
|
|
... gt_seg_data_sample, show=True)
|
|
""" # noqa
|
|
|
|
def __init__(self,
|
|
name: str = 'visualizer',
|
|
image: Optional[np.ndarray] = None,
|
|
vis_backends: Optional[Dict] = None,
|
|
save_dir: Optional[str] = None,
|
|
classes: Optional[List] = None,
|
|
palette: Optional[List] = None,
|
|
dataset_name: Optional[str] = None,
|
|
alpha: float = 0.8,
|
|
**kwargs):
|
|
super().__init__(name, image, vis_backends, save_dir, **kwargs)
|
|
self.alpha: float = alpha
|
|
self.set_dataset_meta(palette, classes, dataset_name)
|
|
|
|
def _get_center_loc(self, mask: np.ndarray) -> np.ndarray:
|
|
"""Get semantic seg center coordinate.
|
|
|
|
Args:
|
|
mask: np.ndarray: get from sem_seg
|
|
"""
|
|
loc = np.argwhere(mask == 1)
|
|
|
|
loc_sort = np.array(
|
|
sorted(loc.tolist(), key=lambda row: (row[0], row[1])))
|
|
y_list = loc_sort[:, 0]
|
|
unique, indices, counts = np.unique(
|
|
y_list, return_index=True, return_counts=True)
|
|
y_loc = unique[counts.argmax()]
|
|
y_most_freq_loc = loc[loc_sort[:, 0] == y_loc]
|
|
center_num = len(y_most_freq_loc) // 2
|
|
x = y_most_freq_loc[center_num][1]
|
|
y = y_most_freq_loc[center_num][0]
|
|
return np.array([x, y])
|
|
|
|
def _draw_sem_seg(self,
|
|
image: np.ndarray,
|
|
sem_seg: PixelData,
|
|
classes: Optional[List],
|
|
palette: Optional[List],
|
|
withLabels: Optional[bool] = True) -> np.ndarray:
|
|
"""Draw semantic seg of GT or prediction.
|
|
|
|
Args:
|
|
image (np.ndarray): The image to draw.
|
|
sem_seg (:obj:`PixelData`): Data structure for pixel-level
|
|
annotations or predictions.
|
|
classes (list, optional): Input classes for result rendering, as
|
|
the prediction of segmentation model is a segment map with
|
|
label indices, `classes` is a list which includes items
|
|
responding to the label indices. If classes is not defined,
|
|
visualizer will take `cityscapes` classes by default.
|
|
Defaults to None.
|
|
palette (list, optional): Input palette for result rendering, which
|
|
is a list of color palette responding to the classes.
|
|
Defaults to None.
|
|
withLabels(bool, optional): Add semantic labels in visualization
|
|
result, Default to True.
|
|
|
|
Returns:
|
|
np.ndarray: the drawn image which channel is RGB.
|
|
"""
|
|
num_classes = len(classes)
|
|
|
|
sem_seg = sem_seg.cpu().data
|
|
ids = np.unique(sem_seg)[::-1]
|
|
legal_indices = ids < num_classes
|
|
ids = ids[legal_indices]
|
|
labels = np.array(ids, dtype=np.int64)
|
|
|
|
colors = [palette[label] for label in labels]
|
|
|
|
mask = np.zeros_like(image, dtype=np.uint8)
|
|
for label, color in zip(labels, colors):
|
|
mask[sem_seg[0] == label, :] = color
|
|
|
|
if withLabels:
|
|
font = cv2.FONT_HERSHEY_SIMPLEX
|
|
# (0,1] to change the size of the text relative to the image
|
|
scale = 0.05
|
|
fontScale = min(image.shape[0], image.shape[1]) / (25 / scale)
|
|
fontColor = (255, 255, 255)
|
|
if image.shape[0] < 300 or image.shape[1] < 300:
|
|
thickness = 1
|
|
rectangleThickness = 1
|
|
else:
|
|
thickness = 2
|
|
rectangleThickness = 2
|
|
lineType = 2
|
|
|
|
if isinstance(sem_seg[0], torch.Tensor):
|
|
masks = sem_seg[0].numpy() == labels[:, None, None]
|
|
else:
|
|
masks = sem_seg[0] == labels[:, None, None]
|
|
masks = masks.astype(np.uint8)
|
|
for mask_num in range(len(labels)):
|
|
classes_id = labels[mask_num]
|
|
classes_color = colors[mask_num]
|
|
loc = self._get_center_loc(masks[mask_num])
|
|
text = classes[classes_id]
|
|
(label_width, label_height), baseline = cv2.getTextSize(
|
|
text, font, fontScale, thickness)
|
|
mask = cv2.rectangle(mask, loc,
|
|
(loc[0] + label_width + baseline,
|
|
loc[1] + label_height + baseline),
|
|
classes_color, -1)
|
|
mask = cv2.rectangle(mask, loc,
|
|
(loc[0] + label_width + baseline,
|
|
loc[1] + label_height + baseline),
|
|
(0, 0, 0), rectangleThickness)
|
|
mask = cv2.putText(mask, text, (loc[0], loc[1] + label_height),
|
|
font, fontScale, fontColor, thickness,
|
|
lineType)
|
|
color_seg = (image * (1 - self.alpha) + mask * self.alpha).astype(
|
|
np.uint8)
|
|
self.set_image(color_seg)
|
|
return color_seg
|
|
|
|
def _draw_depth_map(self, image: np.ndarray,
|
|
depth_map: PixelData) -> np.ndarray:
|
|
"""Draws a depth map on a given image.
|
|
|
|
This function takes an image and a depth map as input,
|
|
renders the depth map, and concatenates it with the original image.
|
|
Finally, it updates the internal image state of the visualizer with
|
|
the concatenated result.
|
|
|
|
Args:
|
|
image (np.ndarray): The original image where the depth map will
|
|
be drawn. The array should be in the format HxWx3 where H is
|
|
the height, W is the width.
|
|
|
|
depth_map (PixelData): Depth map to be drawn. The depth map
|
|
should be in the form of a PixelData object. It will be
|
|
converted to a torch tensor if it is a numpy array.
|
|
|
|
Returns:
|
|
np.ndarray: The concatenated image with the depth map drawn.
|
|
|
|
Example:
|
|
>>> depth_map_data = PixelData(data=torch.rand(1, 10, 10))
|
|
>>> image = np.random.randint(0, 256,
|
|
>>> size=(10, 10, 3)).astype('uint8')
|
|
>>> visualizer = SegLocalVisualizer()
|
|
>>> visualizer._draw_depth_map(image, depth_map_data)
|
|
"""
|
|
depth_map = depth_map.cpu().data
|
|
if isinstance(depth_map, np.ndarray):
|
|
depth_map = torch.from_numpy(depth_map)
|
|
if depth_map.ndim == 2:
|
|
depth_map = depth_map[None]
|
|
|
|
depth_map = self.draw_featmap(depth_map, resize_shape=image.shape[:2])
|
|
out_image = np.concatenate((image, depth_map), axis=0)
|
|
self.set_image(out_image)
|
|
return out_image
|
|
|
|
def set_dataset_meta(self,
|
|
classes: Optional[List] = None,
|
|
palette: Optional[List] = None,
|
|
dataset_name: Optional[str] = None) -> None:
|
|
"""Set meta information to visualizer.
|
|
|
|
Args:
|
|
classes (list, optional): Input classes for result rendering, as
|
|
the prediction of segmentation model is a segment map with
|
|
label indices, `classes` is a list which includes items
|
|
responding to the label indices. If classes is not defined,
|
|
visualizer will take `cityscapes` classes by default.
|
|
Defaults to None.
|
|
palette (list, optional): Input palette for result rendering, which
|
|
is a list of color palette responding to the classes.
|
|
Defaults to None.
|
|
dataset_name (str, optional): `Dataset name or alias <https://github.com/open-mmlab/mmsegmentation/blob/main/mmseg/utils/class_names.py#L302-L317>`_
|
|
visulizer will use the meta information of the dataset i.e.
|
|
classes and palette, but the `classes` and `palette` have
|
|
higher priority. Defaults to None.
|
|
""" # noqa
|
|
# Set default value. When calling
|
|
# `SegLocalVisualizer().dataset_meta=xxx`,
|
|
# it will override the default value.
|
|
if dataset_name is None:
|
|
dataset_name = 'cityscapes'
|
|
classes = classes if classes else get_classes(dataset_name)
|
|
palette = palette if palette else get_palette(dataset_name)
|
|
assert len(classes) == len(
|
|
palette), 'The length of classes should be equal to palette'
|
|
self.dataset_meta: dict = {'classes': classes, 'palette': palette}
|
|
|
|
@master_only
|
|
def add_datasample(
|
|
self,
|
|
name: str,
|
|
image: np.ndarray,
|
|
data_sample: Optional[SegDataSample] = None,
|
|
draw_gt: bool = True,
|
|
draw_pred: bool = True,
|
|
show: bool = False,
|
|
wait_time: float = 0,
|
|
# TODO: Supported in mmengine's Viusalizer.
|
|
out_file: Optional[str] = None,
|
|
step: int = 0,
|
|
withLabels: Optional[bool] = True) -> None:
|
|
"""Draw datasample and save to all backends.
|
|
|
|
- If GT and prediction are plotted at the same time, they are
|
|
displayed in a stitched image where the left image is the
|
|
ground truth and the right image is the prediction.
|
|
- If ``show`` is True, all storage backends are ignored, and
|
|
the images will be displayed in a local window.
|
|
- If ``out_file`` is specified, the drawn image will be
|
|
saved to ``out_file``. it is usually used when the display
|
|
is not available.
|
|
|
|
Args:
|
|
name (str): The image identifier.
|
|
image (np.ndarray): The image to draw.
|
|
gt_sample (:obj:`SegDataSample`, optional): GT SegDataSample.
|
|
Defaults to None.
|
|
pred_sample (:obj:`SegDataSample`, optional): Prediction
|
|
SegDataSample. Defaults to None.
|
|
draw_gt (bool): Whether to draw GT SegDataSample. Default to True.
|
|
draw_pred (bool): Whether to draw Prediction SegDataSample.
|
|
Defaults to True.
|
|
show (bool): Whether to display the drawn image. Default to False.
|
|
wait_time (float): The interval of show (s). Defaults to 0.
|
|
out_file (str): Path to output file. Defaults to None.
|
|
step (int): Global step value to record. Defaults to 0.
|
|
withLabels(bool, optional): Add semantic labels in visualization
|
|
result, Defaults to True.
|
|
"""
|
|
classes = self.dataset_meta.get('classes', None)
|
|
palette = self.dataset_meta.get('palette', None)
|
|
|
|
gt_img_data = None
|
|
pred_img_data = None
|
|
|
|
if draw_gt and data_sample is not None:
|
|
if 'gt_sem_seg' in data_sample:
|
|
assert classes is not None, 'class information is ' \
|
|
'not provided when ' \
|
|
'visualizing semantic ' \
|
|
'segmentation results.'
|
|
gt_img_data = self._draw_sem_seg(image, data_sample.gt_sem_seg,
|
|
classes, palette, withLabels)
|
|
|
|
if 'gt_depth_map' in data_sample:
|
|
gt_img_data = gt_img_data if gt_img_data is not None else image
|
|
gt_img_data = self._draw_depth_map(gt_img_data,
|
|
data_sample.gt_depth_map)
|
|
|
|
if draw_pred and data_sample is not None:
|
|
|
|
if 'pred_sem_seg' in data_sample:
|
|
|
|
assert classes is not None, 'class information is ' \
|
|
'not provided when ' \
|
|
'visualizing semantic ' \
|
|
'segmentation results.'
|
|
pred_img_data = self._draw_sem_seg(image,
|
|
data_sample.pred_sem_seg,
|
|
classes, palette,
|
|
withLabels)
|
|
|
|
if 'pred_depth_map' in data_sample:
|
|
pred_img_data = pred_img_data if pred_img_data is not None \
|
|
else image
|
|
pred_img_data = self._draw_depth_map(
|
|
pred_img_data, data_sample.pred_depth_map)
|
|
|
|
if gt_img_data is not None and pred_img_data is not None:
|
|
drawn_img = np.concatenate((gt_img_data, pred_img_data), axis=1)
|
|
elif gt_img_data is not None:
|
|
drawn_img = gt_img_data
|
|
else:
|
|
drawn_img = pred_img_data
|
|
|
|
if show:
|
|
self.show(drawn_img, win_name=name, wait_time=wait_time)
|
|
|
|
if out_file is not None:
|
|
mmcv.imwrite(mmcv.rgb2bgr(drawn_img), out_file)
|
|
else:
|
|
self.add_image(name, drawn_img, step)
|